需求
特定场景下,Linux主机单网络接口会绑定成百上千个IP地址,需找出流量IN/OUT TOP N的地址
sFlow 概述
sFlow - sampled flow的缩写,最初由InMon公司开发,是一种监控高速交换网络的工业标准技术,可用来网络性能监控、计费、网络攻击对抗等
sflow可理解为C/S架构:
sflow agent: 用以信息采集,一般内置于交换机、路由器中,已被绝大多数厂商支持

sflow collector: 用以数据收集,一般独立部署于服务器中
sflow支持两种形式的采样:
流采样,sflow agent按照特定配置(方法)在指定端口上对报文进行采样分析

端口采样,sflow agent周期获取指定端口的流量统计数据
sflowtool
sflowtool是由InMon开源的sflow收集/转发器
可以输出JSON CSV等格式数据,具体可查看帮助
1 | sflowtool -h |
统计测试脚本示例 - 来源git log,不知道项目中为什么把统计示例删掉?!
sflowtool | ./ipTopTalkers
ipTopTalkers
1 | #!/usr/bin/awk -f |
sflowtool | ./ipTrafficMatrix
ipTrafficMatrix
1 | #!/usr/bin/awk -f |
Python从标准输出读取并分析打印数据
1 | #!/usr/bin/env python |
Demo实现思路
将Python示例脚本进行简单逻辑处理 ---> 数据存入InfluxDB ---> Grafana从InfluxDB读取数据进行展示
python读取数据并进一步处理
- 用local_ip,remote_ip代替srcIP,dstIP; local_ip代表本地IP地址
- 新增direction,用以标识数据流向in/out
- 可以基于datagramSourceIP值,将不同数据源存到不同'表'
InfluxDB大致数据存储形式:
tagKey
direction local_ip remote ipfieldKey
pktsizeGrafana绘图要点:
Variables 定义 test_local_ip
1 | show tag values from test with key = "local_ip" |
查询语句
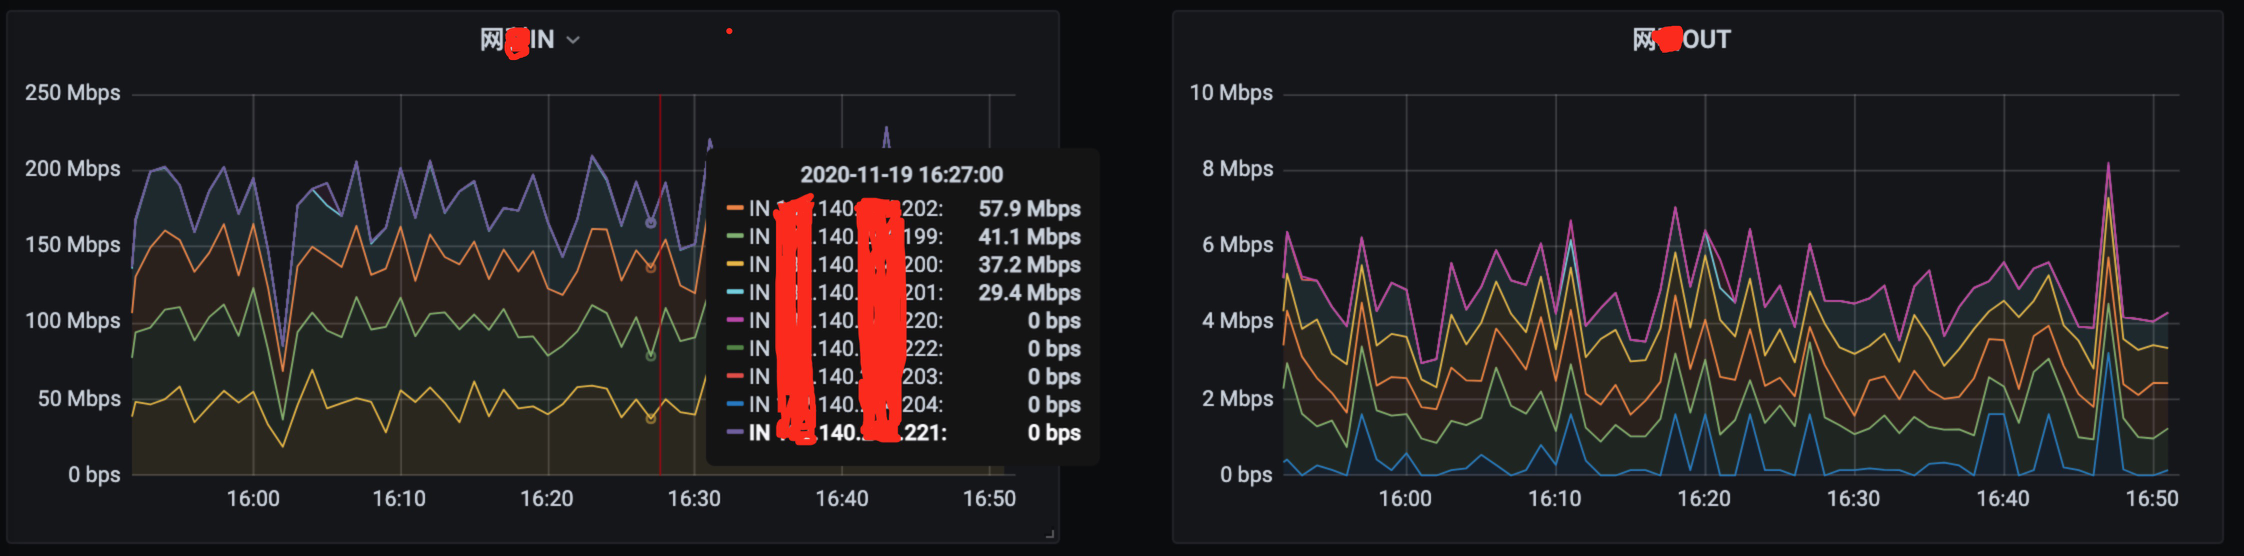
1 | SELECT sum("pktsize") / 60 * 8 FROM "test" WHERE ("direction" = 'in' AND "local_ip" =~ /^$test_local_ip$/) AND $timeFilter GROUP BY time(1m), "local_ip" fill(0) |
效果
IN OUT排序利用的Grafana页面功能
扩展
通过提取存储更多的字段信息,实现
- 流量TOP N中指定IP的TOP N连接: TODO 怎样直观展示
- 端口/协议百分比
- 感知SYN/RST Flood等
参考链接
sFlow wiki
sflow.org
sflowtool github地址
rfc 3176
sflow-collector